Shiyang Ni
Z0019629
Key Results
- Estimating the slippage cost realistically is critical to the successful backtesting of an option hedging strategy.
- The bid-ask spread exhibits no clear intraday trend or U-shape pattern for almost all contracts. They concentrate within a fixed range.
- The bid-ask is mostly stable throughout a contract’s life cycle. It’s slightly wider during the early stages when the contract is just listed, and quite erratic during the delivery month. The change with life-stages is more pronounced with contracts from non-active months.
- We summarized the common quantiles for the bid-ask spread for each contract both by day and by life stages. These numbers will be referenced in future backtesting.
Introduction
A good estimation of trading costs is critical to realistic backtesting, especially for an option strategy with hedging. Whichever hedging method we adopt, we need to constantly trade futures and thus incur significant cost from trading. If the trading costs are not properly estimated, the backtesting result is essentially useless.
Trading cost comprises of two main components: commission and slippage. The former is typically a fixed parameter, either charged as a percentage of the instrument’s market value, or a fixed cost per contract. The latter, however, is more much complicated. It is affected by both the LOB thickness and the order size, and can be further complicated by the behavior of other high frequency players. Ideally the slippage should be modeled as a function of all these factors, but in practice such a method is usually too complex to implement. We thus need a rule of thumb for estimating the slippage.
The simplest method for estimating slippage is to use the bid-ask spread. When a market order is placed, it is matched against the best available price. Assuming that the limit order book (LOB) does not change significantly between the order being placed and executed, the best available price is the ask1 for buy orders and the bid1 for sell orders. If the last price is close to the midpoint of ask1 and bid1, the slippage incurred is approximately half of the bid-ask spread.
The goal of this report is to estimate the typical size of the bid-ask spread. First, we investigate whether the bid-ask spread shows any intraday patterns. In the stock market, trading volume often follows a U-shaped pattern—higher in the first half-hour after the market opens and the last half-hour before it closes. In this case, the bid-ask spread would likely be narrower at the beginning and end of each trading period and wider in the middle. If a similar pattern exists in the futures market, it would be beneficial to analyze the bid-ask spread separately for these two periods.
Next, we examine how the bid-ask spread changes as a contract approaches expiration. For each day, we summarize the distribution of the bid-ask spread and visualize it using a box plot. We will also record key quantiles of these daily distributions to serve as benchmarks for assessing the liquidity of a given contract on a specific date.
Evolution through a single day: no clear intraday trend exists, except during the early and final stages of an contract’s life cycle
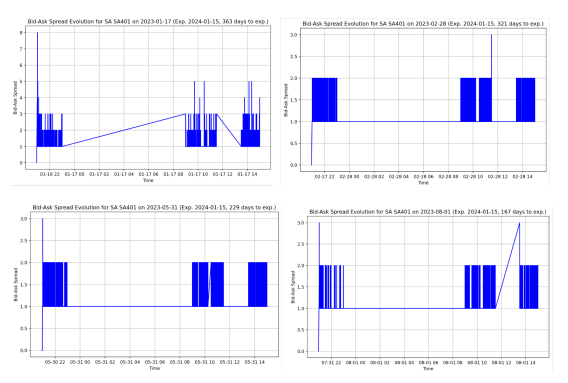
The intraday pattern of the bid-ask spread may change during different stages of a contract’s life cycle. Trading activity may take a while to gather momentum when the contract is first listed, and will likely die down as it approaches the delivery month. During these two periods liquidity might be weaker, causing the bid-ask spread to exhibit more erratic behavior. To preclude the impact of time till maturity, we sampled three days for each month during which the contract is actively traded and plot the intraday evolution of the bid-ask spread for all days.
Below we present 8 plots. The first four are from the contract’s early life (maturity minus 1 year to minus 5 months). The next three are from the contract prime(maturity minus 5 months to 1 month). The last one is from the delivery month. Except for the day from the delivery month, the bid-ask appears to bounce within a fixed range for all days, demonstrating no intraday trend. That fixed range remains between 1 and 2 for most of the contract’s life, though it’s slightly wider during the first month after being listed, and very erratic throughout the delivery month.


We observe the same thing for contracts of other commodties. Take CJ, the Chinese dates futures, as an example. This commodity sees a relatively low turnover, but the bid-ask is still mostly stable within a small range, exhibiting no intraday trend. During the delivery month, the bid-ask experiences much larger swings, similar to what we observed with SA.

Evolution Through Time: Stable throughout periods of active-trading
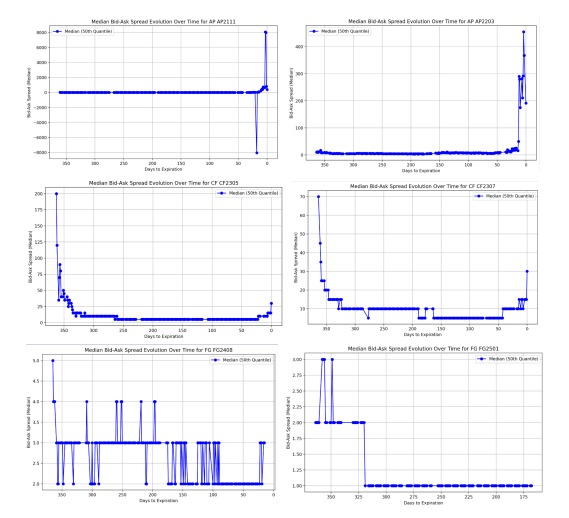
As long as the contract is actively traded, the bid-ask spread remains mostly constant, unaffected by the progression towards expiration. This is good news because we don’t need to partition the time too finely when gauging the bid-ask spread of a particular contract. This fact allows us to summarize the bid-ask spread by contract only, rather than by both contract and time.
Below we present how the median bid-ask spread evolves as the contract approaches expiry. As the intraday bid-ask spread concentrates within a small range centered around the median, the median is representative of the entire day’s data. Each row contains the plots for two contracts on a single commodity, one from an active month on the left, and the other from a non-active month on the right. While both contracts exhibit a stable bid-ask over time, the spread for the non-active-month contract experiences greater fluctuation.

Magnitude of bid-ask spreads by contract and life-stages
We want a quick estimate of the bid-ask spread during backtesting. One way is to summarize the bid-ask for each contract on every trading date, and use the common quantiles from that distribution. We can adjust the quantile to reflect different liquidity stress levels – for example use the 99th quantile if the liquidity is drained and the 50th quantile otherwise. This method has the advantage of closely approximating the real history, but it suffers the potential drawback of instability. One has to inspect the data for all days to make sure no erratic values are unexpectedly used.
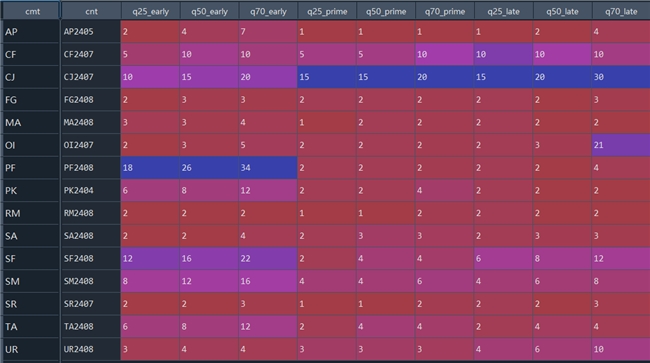
An alternative method is to use even simpler summaries for each contract. For each contract, instead of providing a summary for every day, we can divide its life cycle into early(the time of listing – delivery minus 5 months), prime and late (delivery minus 5 months to delivery minus 40 calendar days), and do a summary for three stages (delivery minus 40 calendar days to the time of delisting). This aggregation makes sense because the bid-ask spread is mostly stable within each stage, and experiences more significant changes between each stage.
Below is a partial result. The complete result is collected in our database to be referenced by future backtesting.


